## 图表和数据集之间的关系
图表和数据集是强关联关系,一个图表需要什么样的数据才能进行展示下面都有说明,以柱状图举例,只能用两个字段的数据集进行数据展示,那使用数据集有2个以上字段那肯定图表无法正常展示,反之有个数据集是3个字段,那就找能展示3个字段的图表,千万别搞小聪明定了好多个字段的数据集,然后从里面挑几个字段进行展示,不要这么干。
## 文本栏
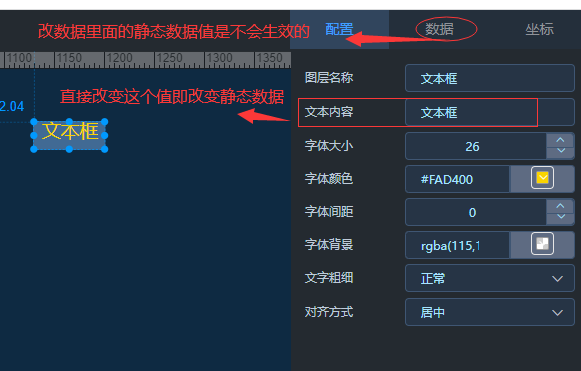
### 文本框


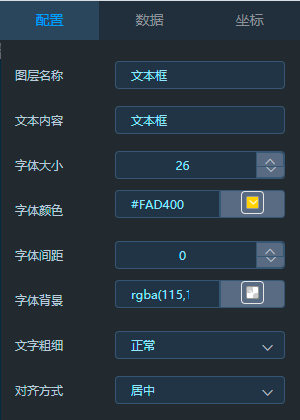
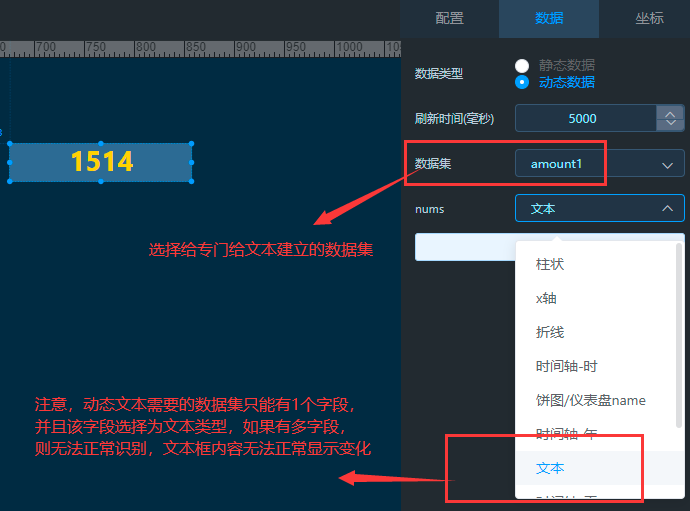
#### 数据格式
### 滚动文本
同文本框,操作无异。
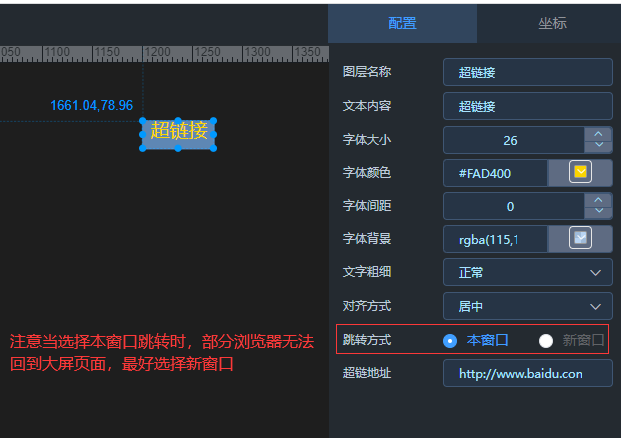
### 超链接
**如有问题,请提交 [Issue](https://gitee.com/anji-plus/report/issues)
**
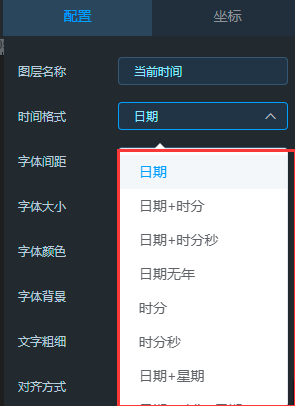
### 当前时间
已支持多种时间格式,其他格式请提交 [Issue](https://gitee.com/anji-plus/report/issues)
### 图片
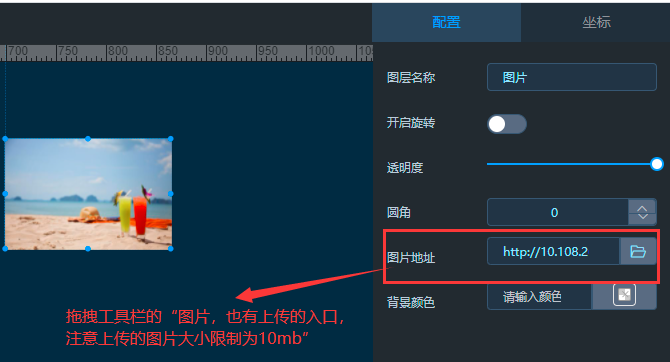
**注:** 如果没有在bootstrap.yml配置文件中没有正确配置上传下载的路径,这里肯定是失败的。
### 视频
**注:** 视频的地址应是直接可以访问的,不需要登录之类。
**暂不支持视频循环播放**
### 表格
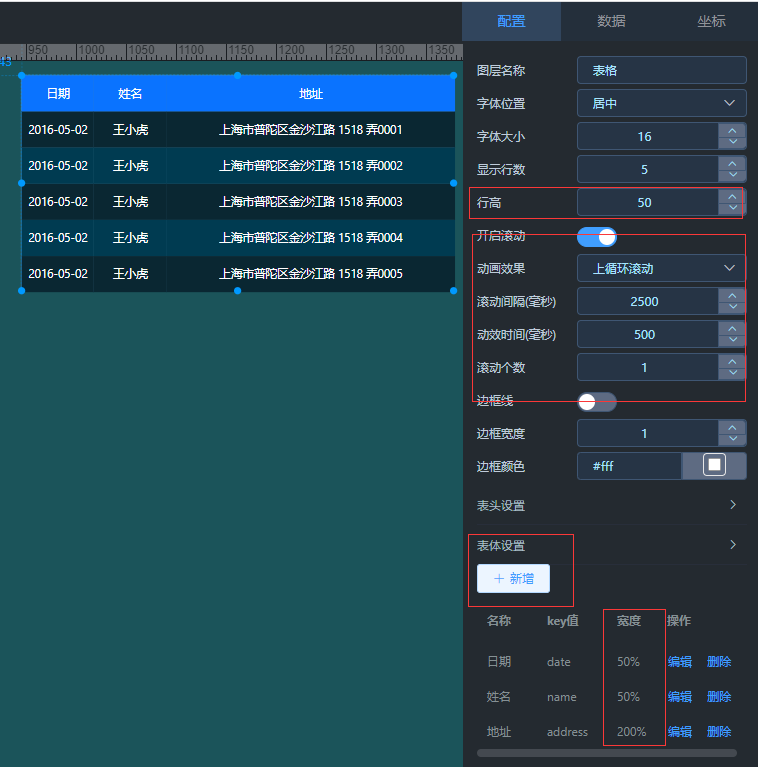
表格字段对应的数据只选择“文本数字”。
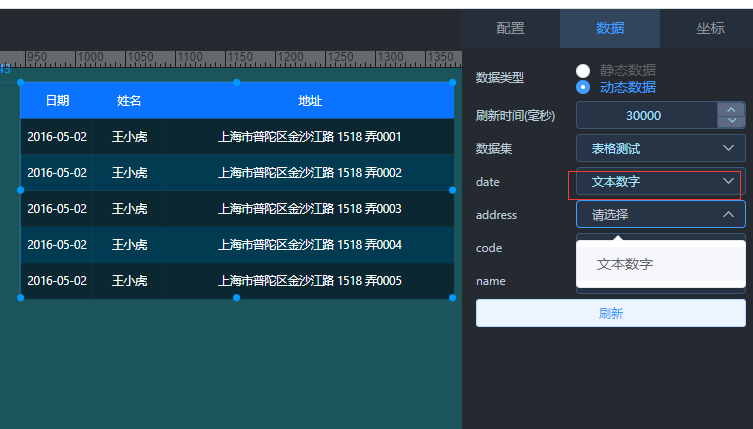
**注意:**
多个字段的时候,需要在“配置-新增”添加你选择数据集所对应的字段,即“配置”中“表体设置”的“key值”要和你“动态数据对应的字段名”保持一致,类似于映射关系。
**如有问题,请提交 [Issue](https://gitee.com/anji-plus/report/issues)
**
### 内联框架
当超链接和视频链接无效的时候,请尝试使用内联框架。
## 样式组件
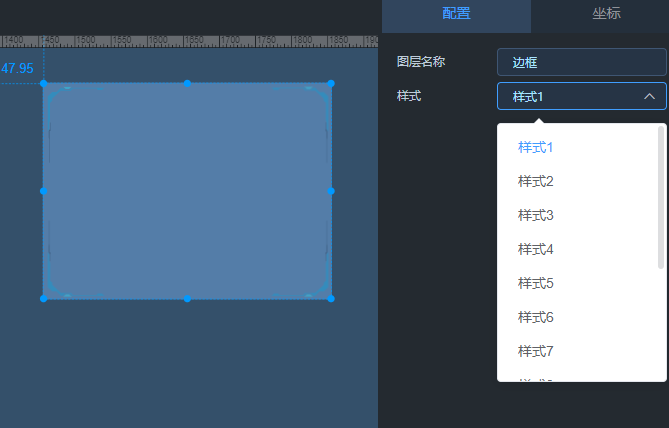
### 边框
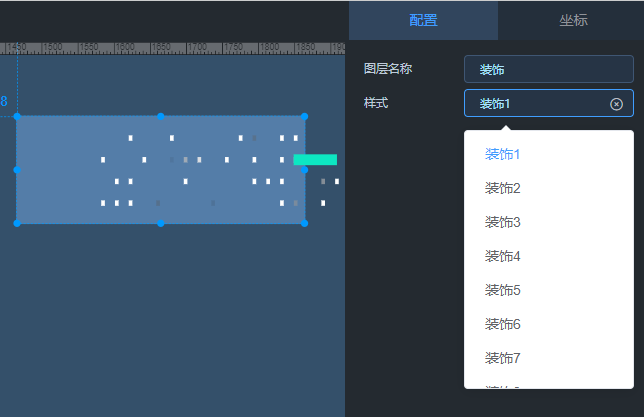
### 装饰
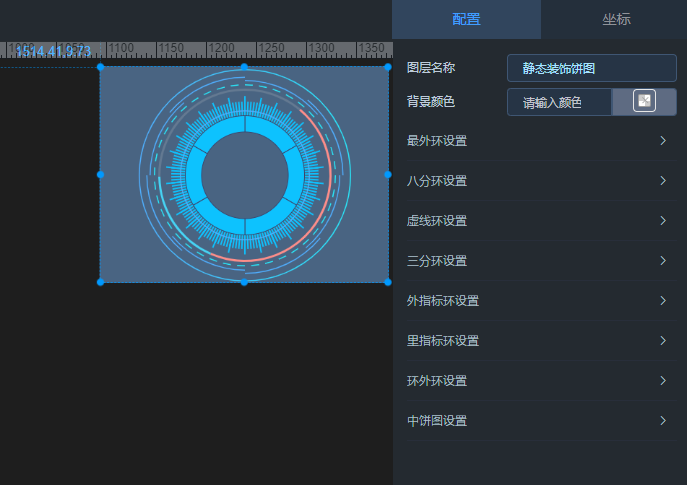
### 装饰饼图
## 柱状图
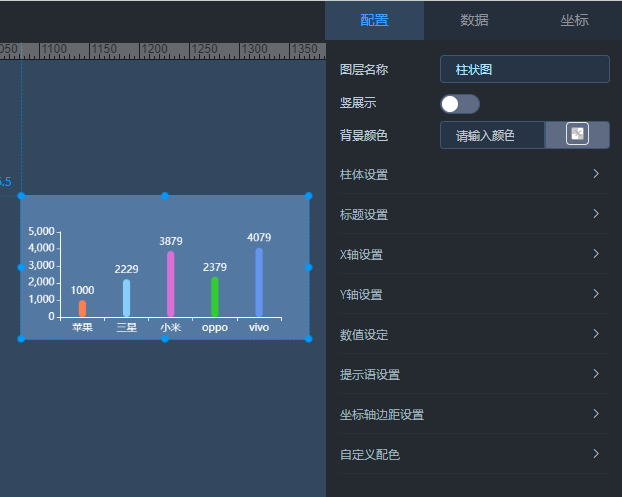
### 柱状图
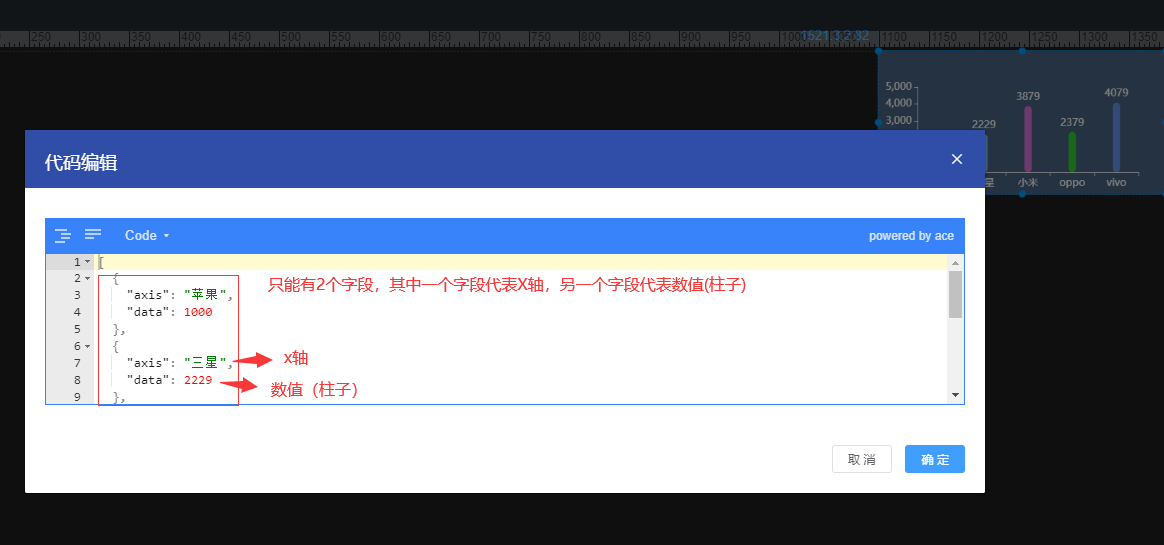
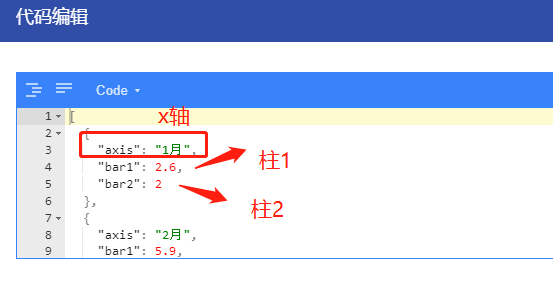
柱状图数据集对应字典值需要选择一个“X轴”、“柱状”,只需要2个字段。
#### 数据格式
**如有问题,请提交 [Issue](https://gitee.com/anji-plus/report/issues)
**
### 柱状图-渐变色
同上柱状图,颜色调整为支持渐变色。
**如有问题,请提交 [Issue](https://gitee.com/anji-plus/report/issues)
**
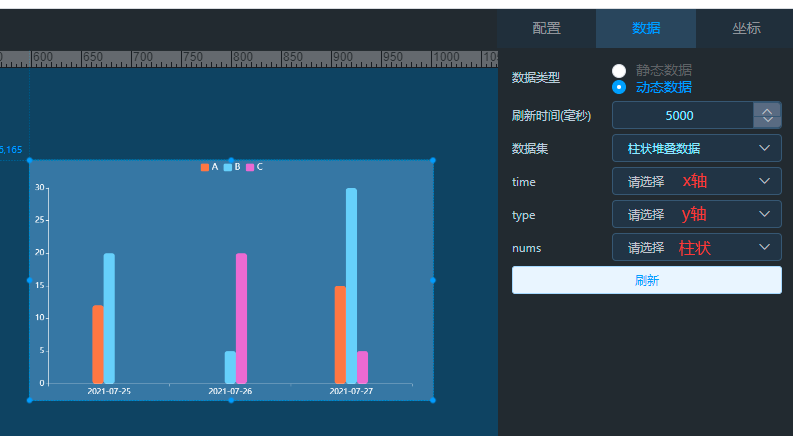
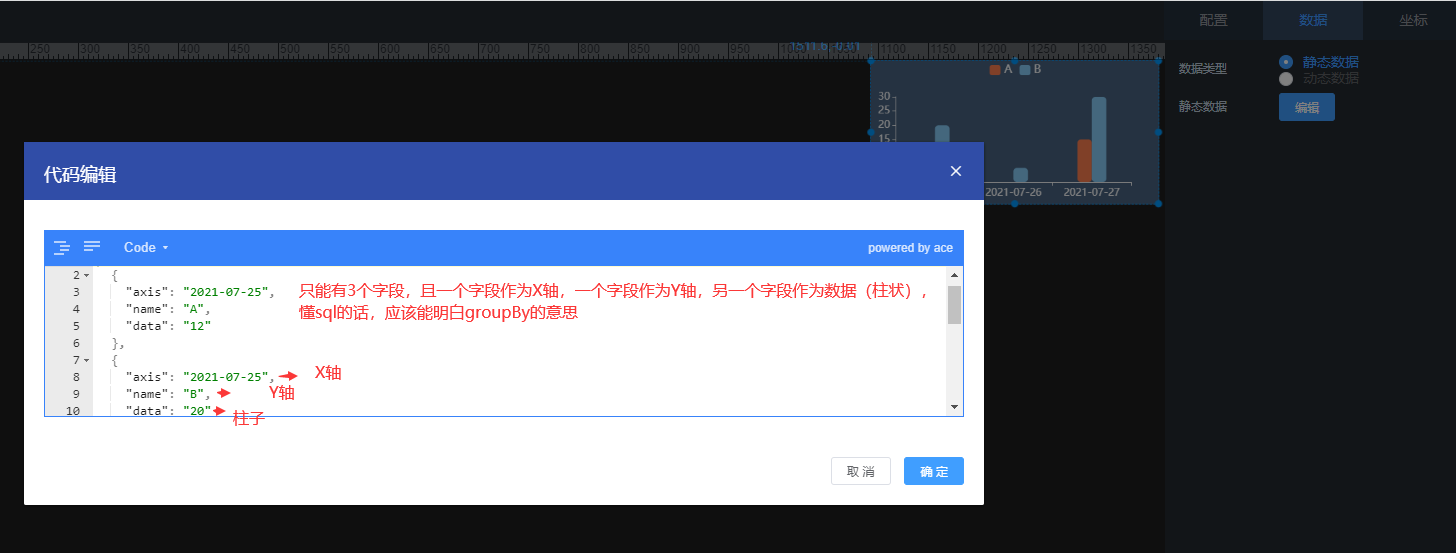
### 柱状堆叠图
动态的数据集对应字典值需要选择一个“X轴”、“Y轴”、“柱状”,也就是说需要3个字段,不明白可以看看静态数据。
#### 数据格式
**如有问题,请提交 [Issue](https://gitee.com/anji-plus/report/issues)
**
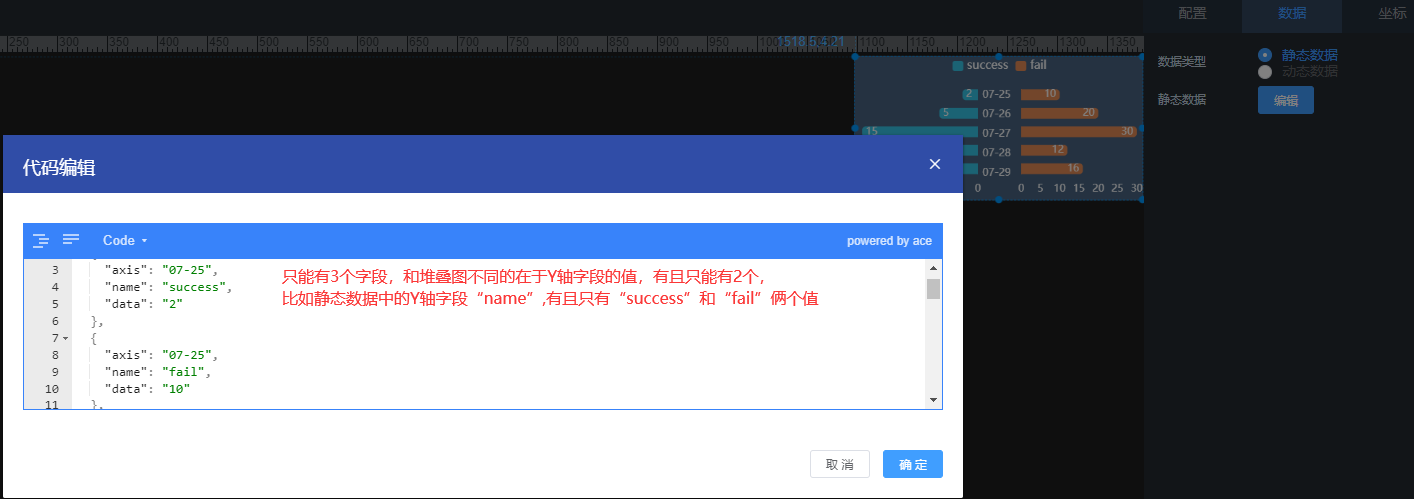
### 柱状对比图
数据集需要3个字段,其中一个作为对比的字段只能为2种值,只有2种值作为对比的字段要选择“y轴字段”字典。因为底层的解析用的是堆叠图的解析,这里的y轴字段并不是指的图表上面的y轴,还请注意,有强迫症可以自行修改源码的解析,剩下的2个字段对应字典看图。
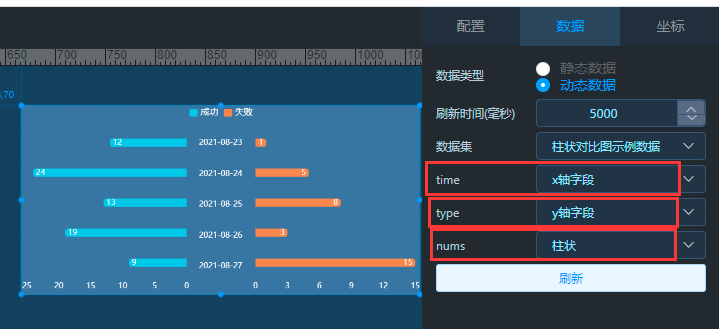
#### 数据格式
**如有问题,请提交 [Issue](https://gitee.com/anji-plus/report/issues)
**
### 双Y柱图
数据集需要3个字段,其中一个字段作为“X轴”,另外两个数值字段选择“柱状”,左右Y轴分别代表选择柱状的俩种数值。
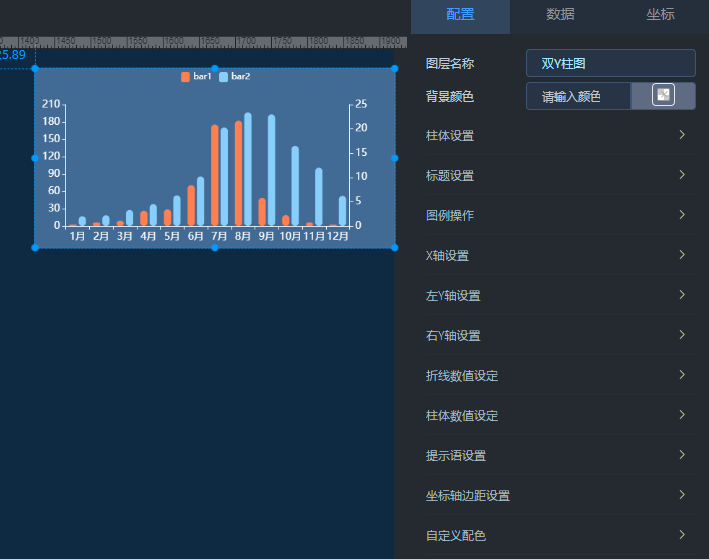
#### 数据格式
**如有问题,请提交 [Issue](https://gitee.com/anji-plus/report/issues)
**
## 折线图
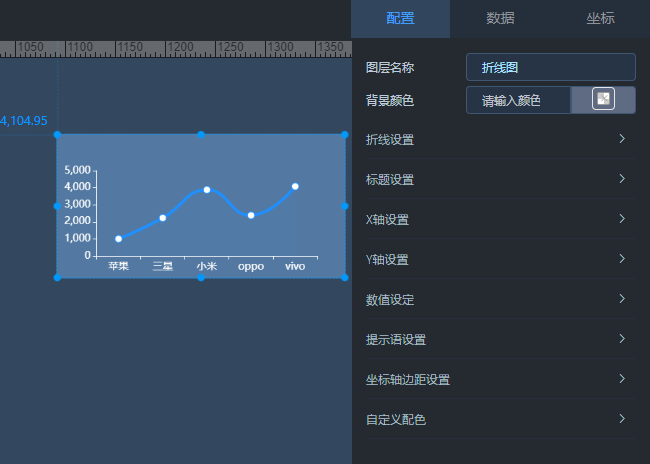
### 折线图
折线图数据集对应字典值需要选择一个“X轴”、“折线”,只需要2个字段。
#### 数据格式
同柱形图数据格式一致。
**如有问题,请提交 [Issue](https://gitee.com/anji-plus/report/issues)
**
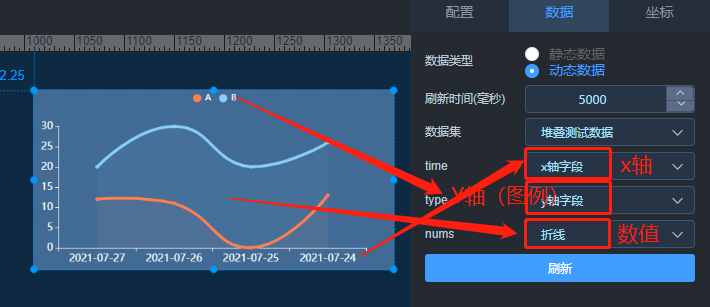
### 折线堆叠图
动态的数据集对应字典值需要选择一个“X轴”、“Y轴”、“折线”,也就是说需要3个字段,不明白可以看看静态数据。
#### 数据格式
同柱状堆叠图数据格式一致。
**如有问题,请提交 [Issue](https://gitee.com/anji-plus/report/issues)
**
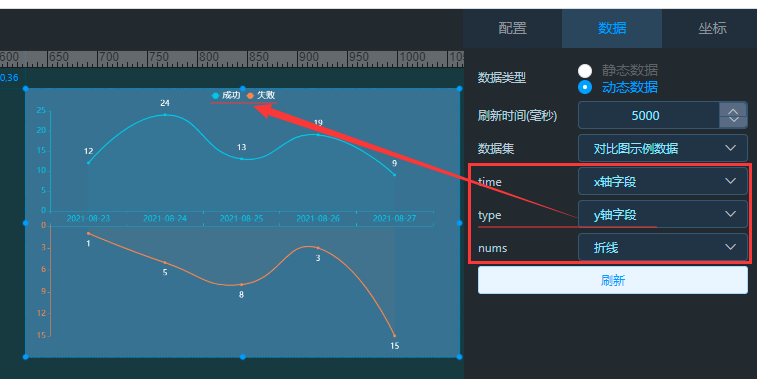
### 折线对比图
数据集需要3个字段,其中一个作为对比的字段只能为2种值,只有2种值作为对比的字段要选择“y轴字段”字典,剩下的字典对应看图。
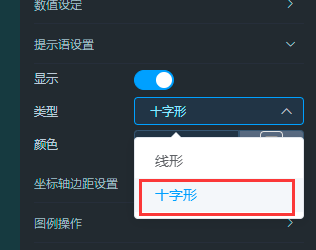
**注**:如果提示语设置选择“十字形”,请注意需要选择“X轴颜色、上Y轴颜色、下Y轴颜色”,不然预览图表鼠标选择是全白色,还请注意。
#### 数据格式
同柱状对比图数据格式一致。
**如有问题,请提交 [Issue](https://gitee.com/anji-plus/report/issues)
**
## 柱线图
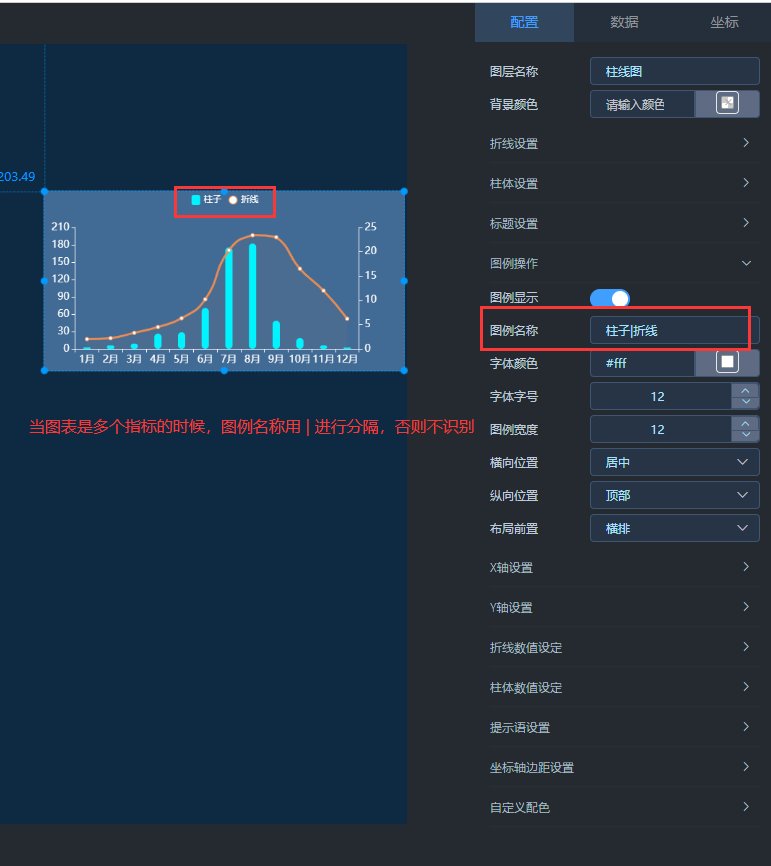
### 柱线图
柱线图数据集对应字典值需要选择一个“X轴”、“柱状”、“折线”,需要3个字段,图例名称用 | 进行分隔。
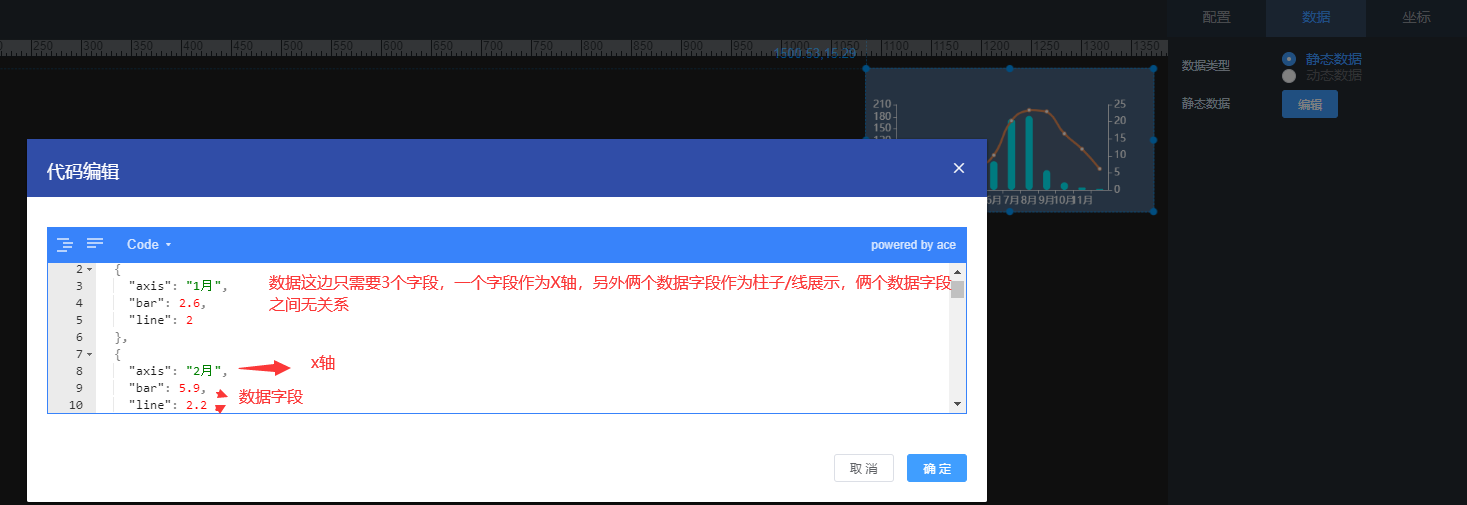
#### 数据格式
**如有问题,请提交 [Issue](https://gitee.com/anji-plus/report/issues)
**
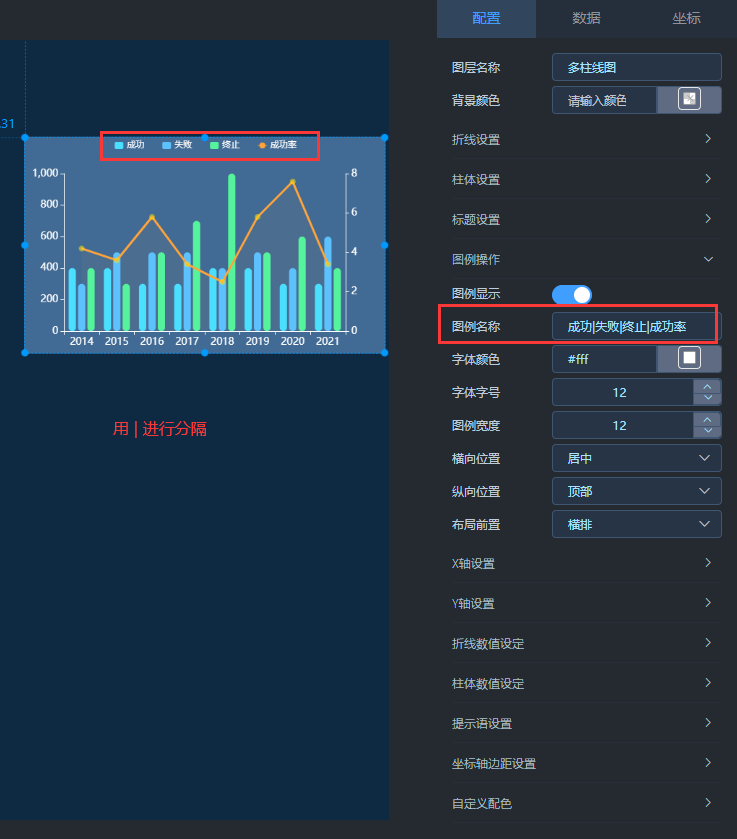
### 多柱线图
多柱线图对应数据字典需要选择一个“X轴”,剩下的字段可任意选择为“柱状”、“折线”,图例名称用 | 进行分隔。
#### 数据格式
**如有问题,请提交 [Issue](https://gitee.com/anji-plus/report/issues)
**
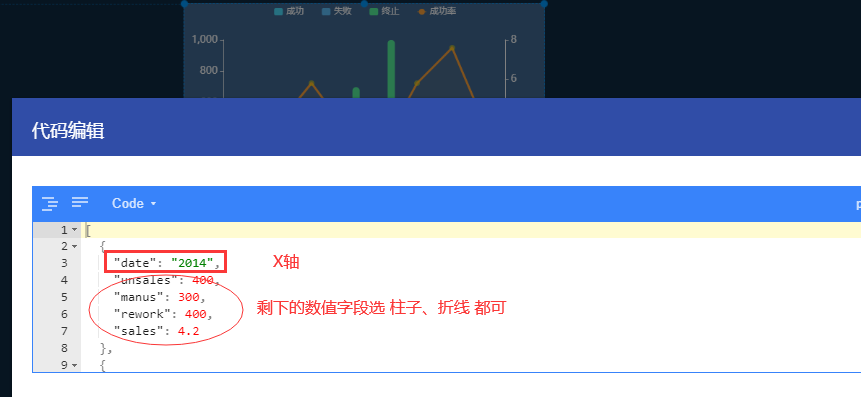
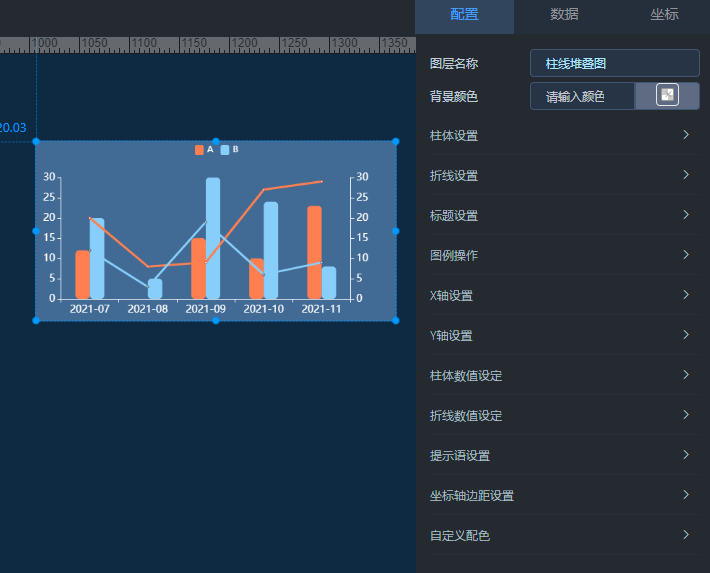
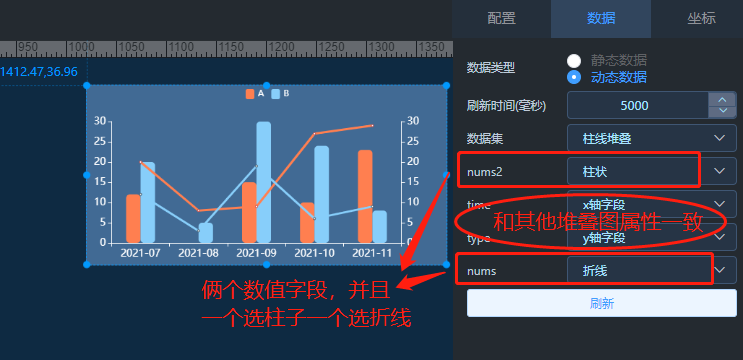
### 柱线堆叠图
图表的基本操作和柱状堆叠图、折线堆叠并无大区别,需要在意的是数据格式的区别,绑定动态数据的时候,需要你数据集有4个字段,其中两个字段作为x,y区分字段,另外俩个作为数值字段。
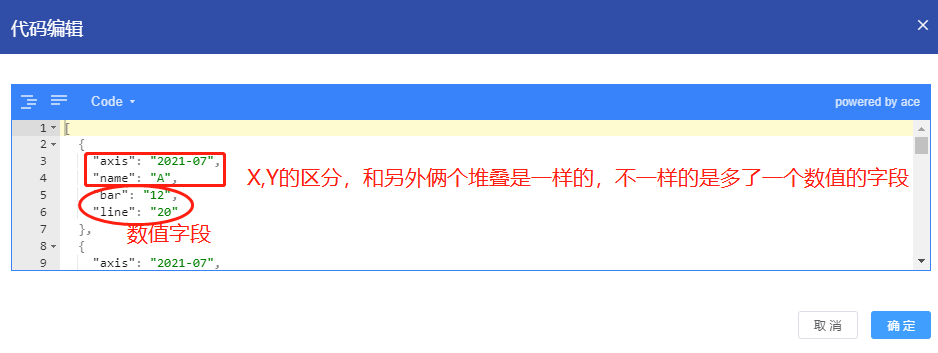
#### 数据格式
和另外俩个堆叠图相比,多了查询的一列数据,比如 "select a,b,sum(c),sum(d) from aa group by a,b" 。
**如有问题,请提交 [Issue](https://gitee.com/anji-plus/report/issues)
**
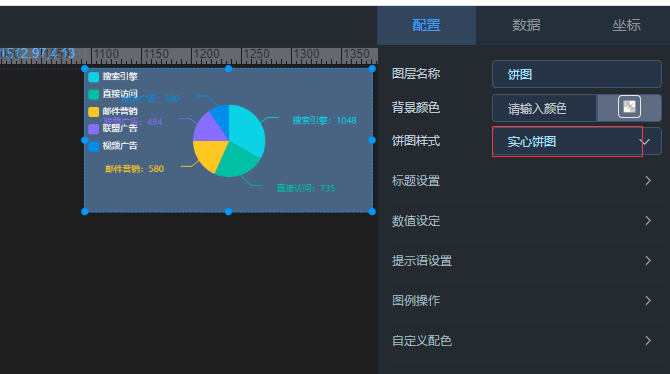
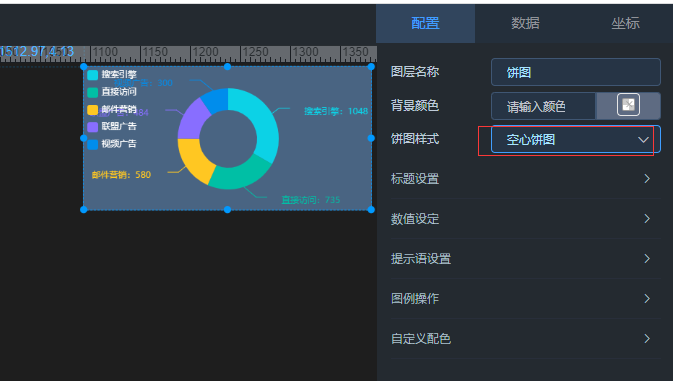
## 饼图
### 饼图
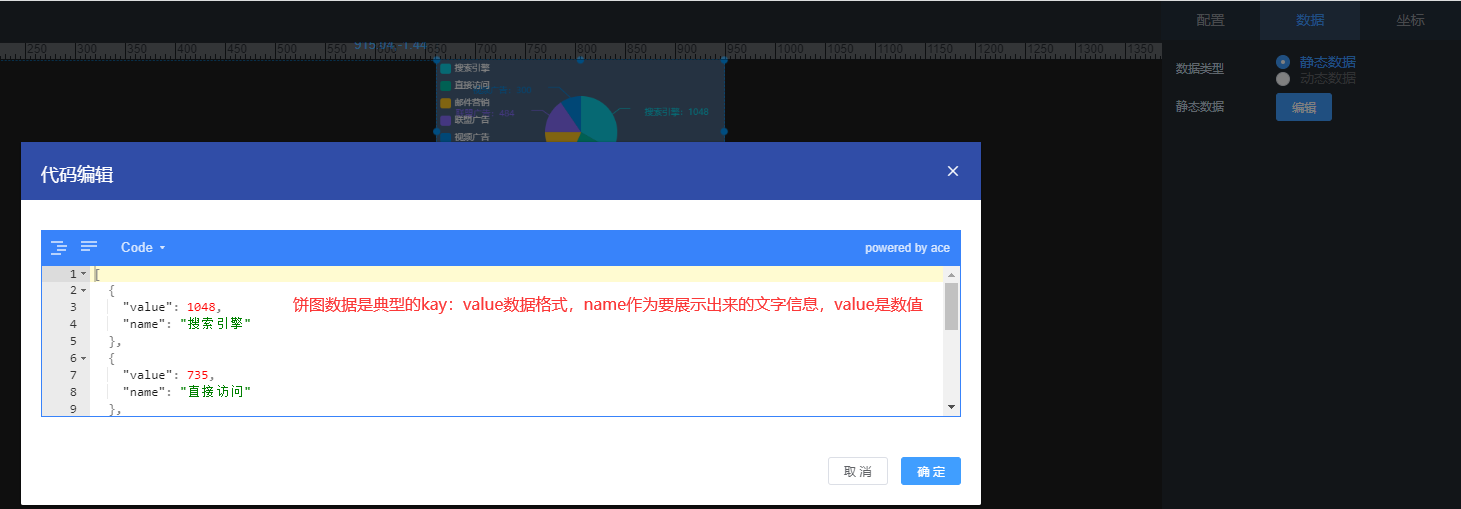
饼图的数据集选择的时候,只能选择饼图对应的字典,即“Name”、“Value”,不明白可以参考静态数据。
#### 数据格式
**如有问题,请提交 [Issue](https://gitee.com/anji-plus/report/issues)
**
### 南丁格尔玫瑰图
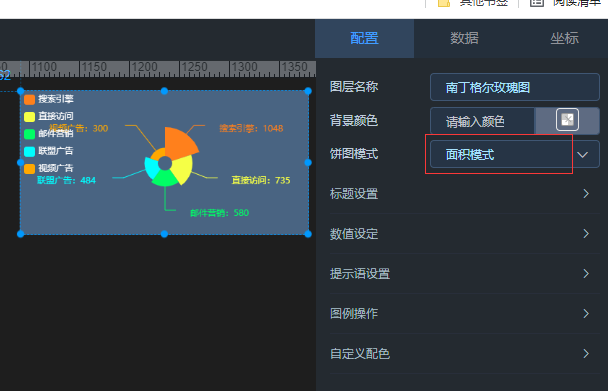
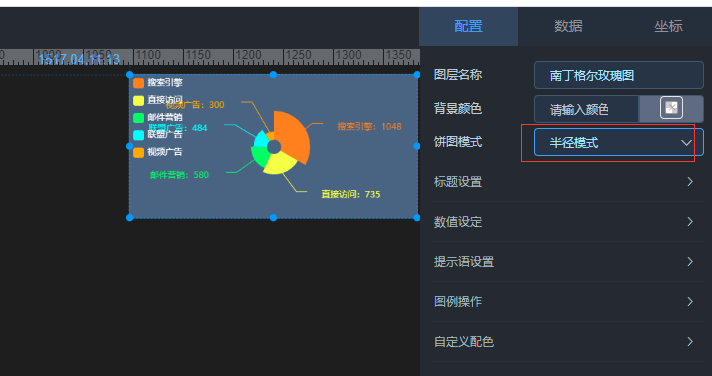
#### 数据格式
同饼图数据格式一致。
**如有问题,请提交 [Issue](https://gitee.com/anji-plus/report/issues)
**
## 漏斗图
### 漏斗图
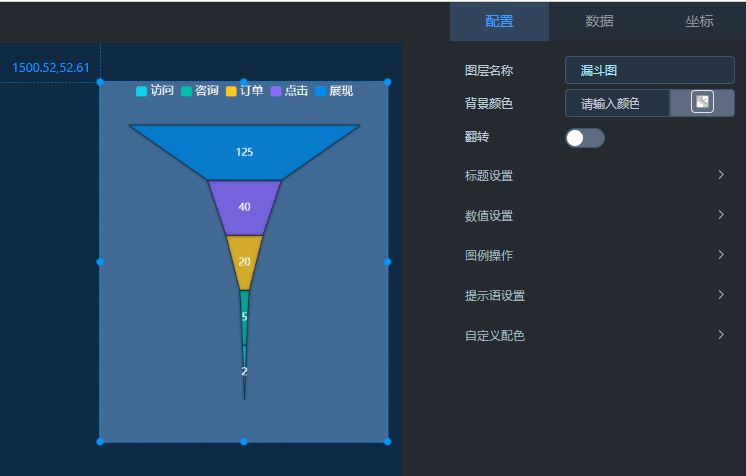
#### 数据格式
同饼图数据格式一致。
**如有问题,请提交 [Issue](https://gitee.com/anji-plus/report/issues)
**
## 百分比
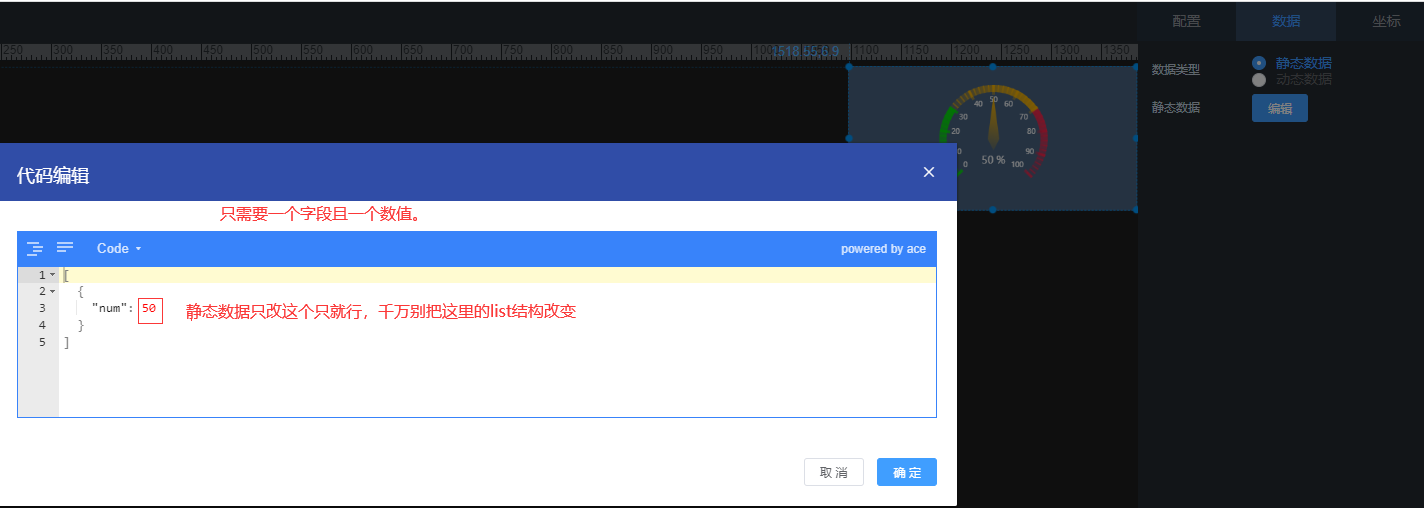
### 仪表盘
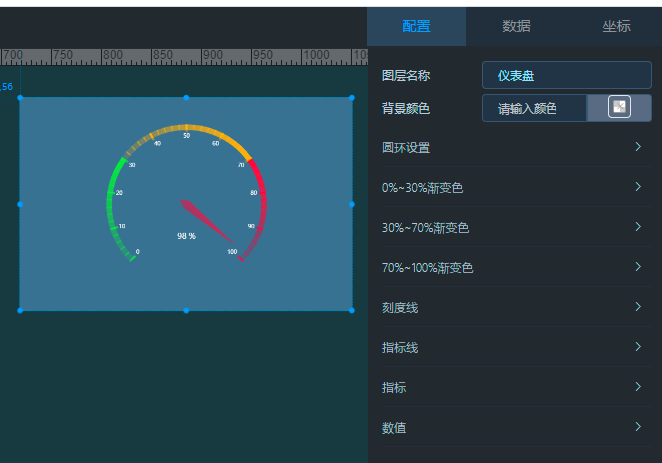
#### 数据格式
**如有问题,请提交 [Issue](https://gitee.com/anji-plus/report/issues)
**
### 百分百图
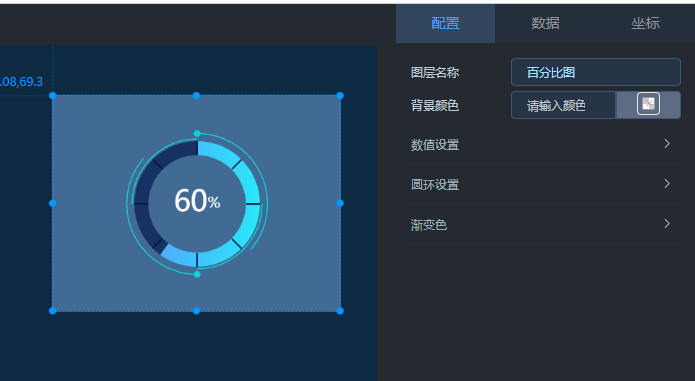
#### 数据格式
同仪表盘数据格式一致。
**如有问题,请提交 [Issue](https://gitee.com/anji-plus/report/issues)
**
## 中国地图
### 路线地图
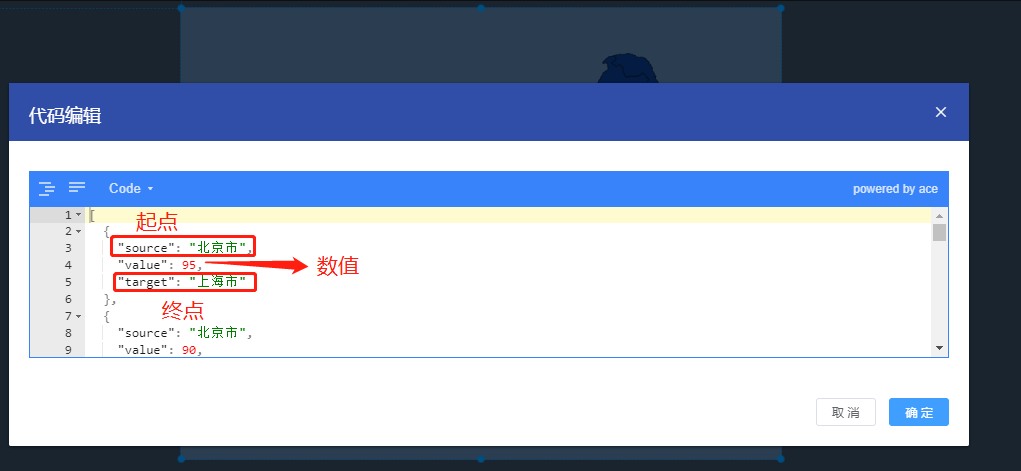
路线图的动态数据集,需要3个字段,“源端”代表起点,“目标端”代表终点,“数值”代表俩点之间的值。
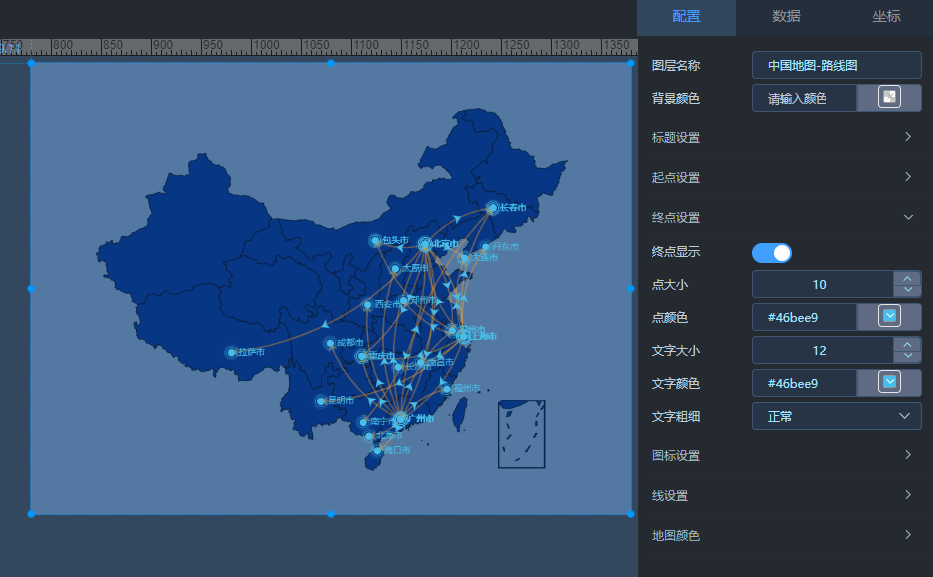
#### 数据格式
可以参考静态数据,目前路线地图仅能显示“市”级别,注意地图数据名称要和地图底层数据名称保持一致,即完整的市名,可以看静态数据,如果和你提供的动态数据名称有差异,请参考源码自行修改。
**如有问题,请提交 [Issue](https://gitee.com/anji-plus/report/issues)
**
### 气泡地图
气泡地图动态数据集,和饼图一样,对应字典值需要选择一个“Name”、“Value”,且name的字段值要和echarts图表里面的值能对应上,可参考静态数据。
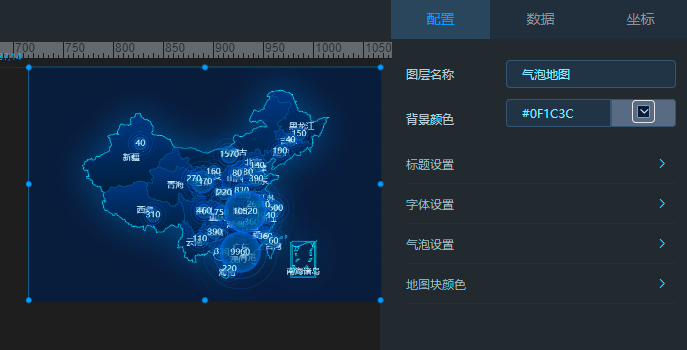
#### 数据格式
可参考静态数据,目前气泡地图仅能显示“省”级别,注意动态数据的名称要和地图底层数据名称保持一致,即完整的省名,可以看静态数据,如果和你提供的动态数据名称有差异,请参考源码自行修改。
**如有问题,请提交 [Issue](https://gitee.com/anji-plus/report/issues)
**
## 词云图
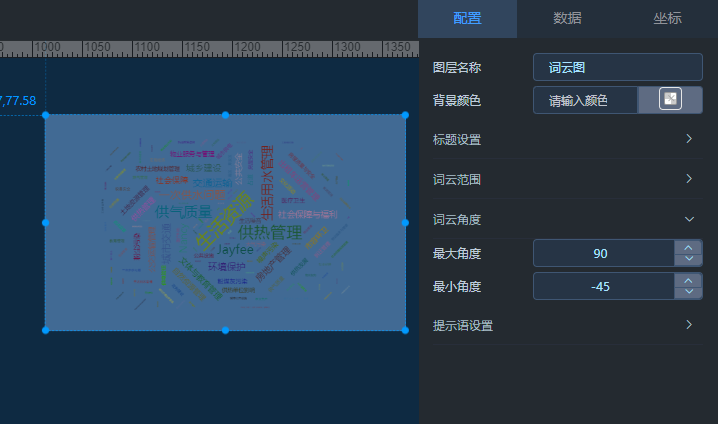
### 词云图
最大最小角度都为0时则文字显示为”正“。所有词云颜色皆是随机产生,动态数据每请求一次数据,所有词云颜色皆改变一次。
#### 数据格式
同饼图、南丁格尔玫瑰图数据一致。
**如有问题,请提交 [Issue](https://gitee.com/anji-plus/report/issues)
**
## 热力图
### 热力图
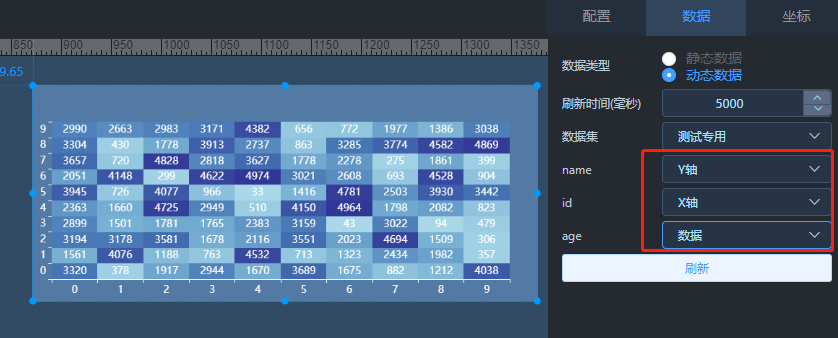
热力图是类似坐标轴一样的数据,当前的热力图数据集需要3个字段值,对应的字典是选择“X轴”,“Y轴”,“数值”,不明白可以看静态数据。
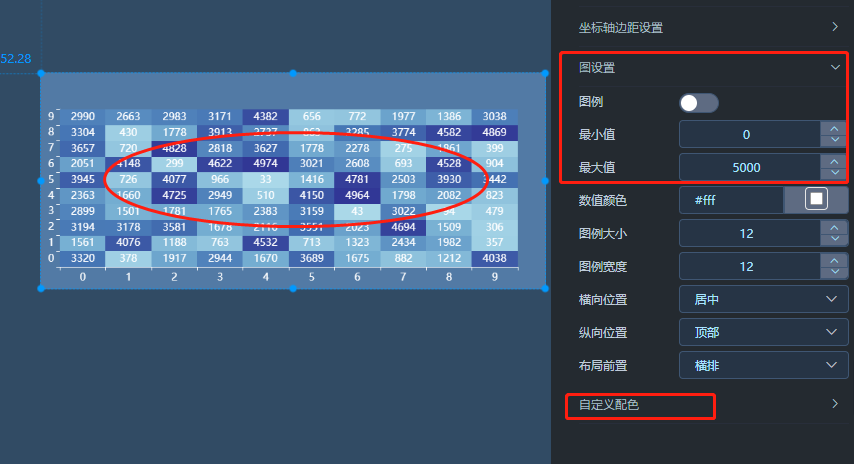
**注意:**
图设置功能中的最大最小值将会对热力图中的数值产生反应,主要根据设定的颜色来反应,数值越靠近最大值,颜色将更深。
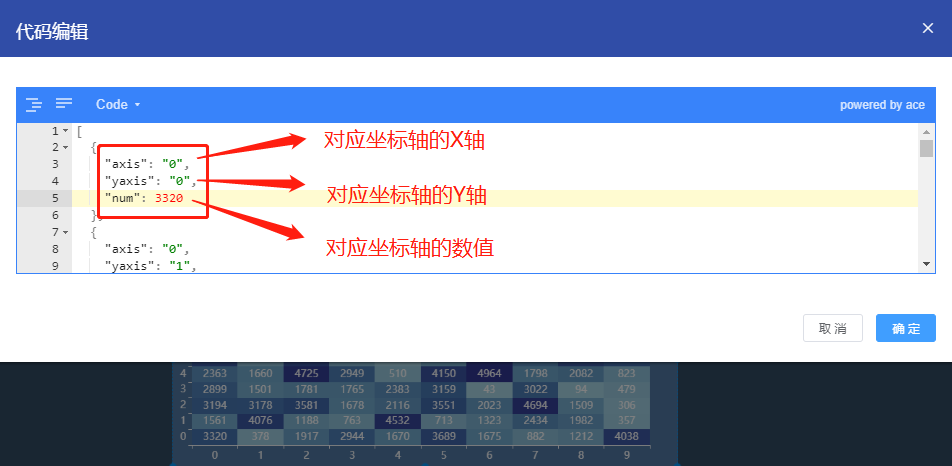
#### 数据格式
**如有问题,请提交 [Issue](https://gitee.com/anji-plus/report/issues)
**
## 雷达图
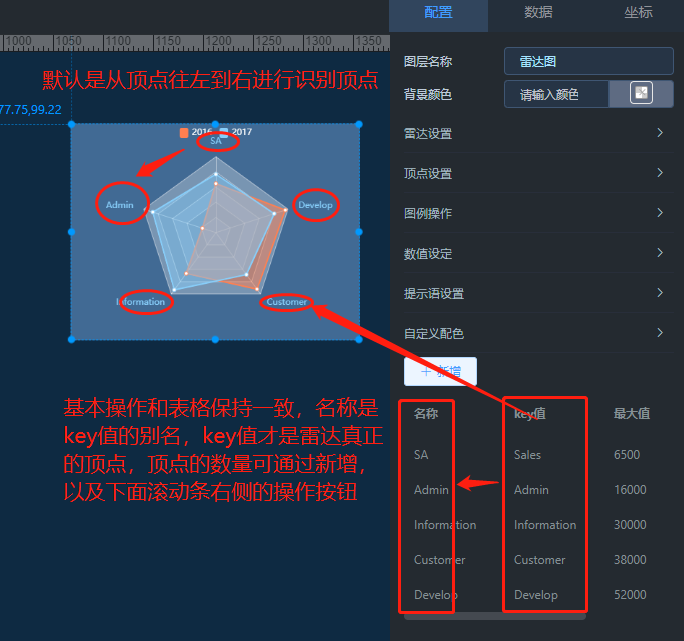
### 雷达图
基本操作和表格一致,通过配置栏的新增按钮和操作按钮对雷达顶点数量进行修改,可生成5边雷达,6边雷达等等,”key值“和”雷达顶点“保持一致,从最上端顶点逆时针规划其他顶点。
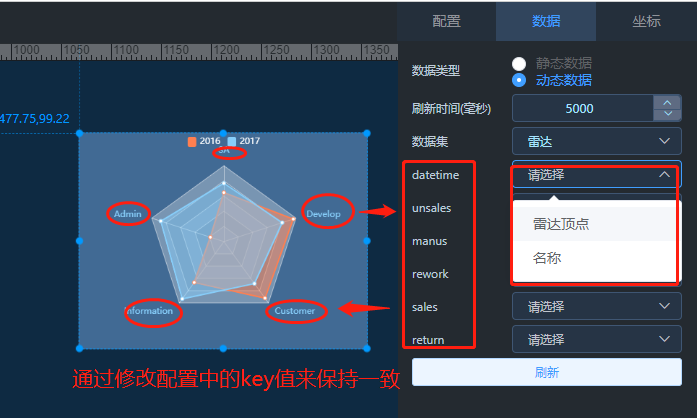
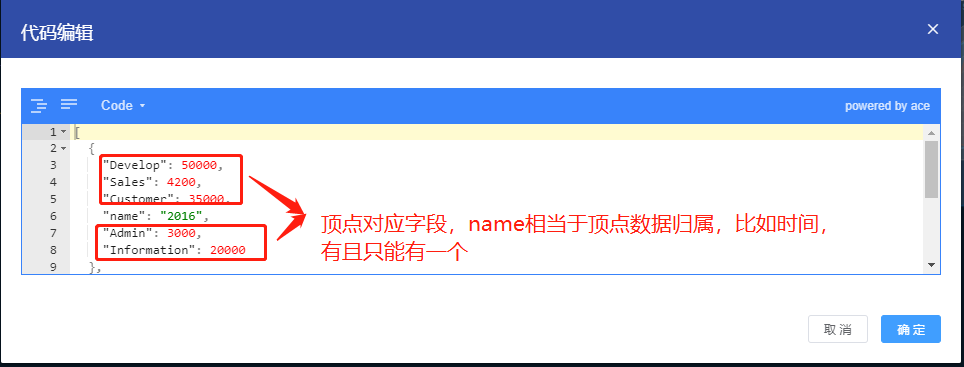
#### 数据格式
数据格式和柱线、多柱线都是类似的,注意实际作为”名称“的字段,比如时间字段,有且只能有1个,其余是”雷达顶点“字段,不明白可以看静态数据格式。
**如有问题,请提交 [Issue](https://gitee.com/anji-plus/report/issues)
**
## 刻度尺
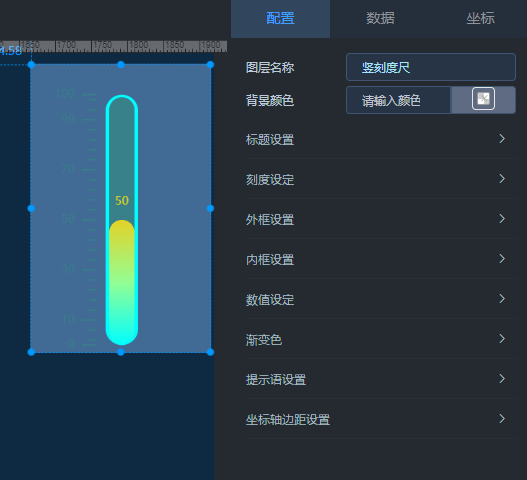
### 竖刻度尺
刻度尺数值的颜色来源于配置的渐变色,渐变色分为0%-30%-50%-70%-100%,数值颜色的变化会随着数值所在颜色区间的变化而变化。通过刻度设定可以调整最大刻度,默认刻度是100。
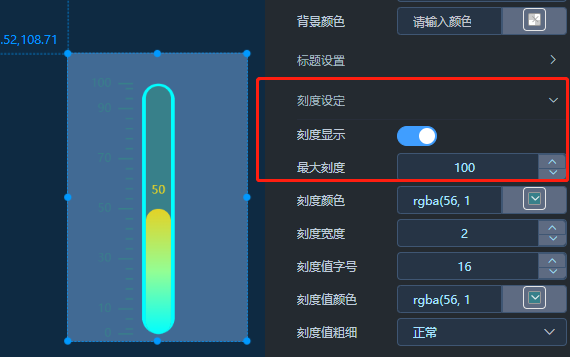
#### 数据格式
单一的数值字段,可看静态数据。
### 横刻度尺
同竖刻度尺。
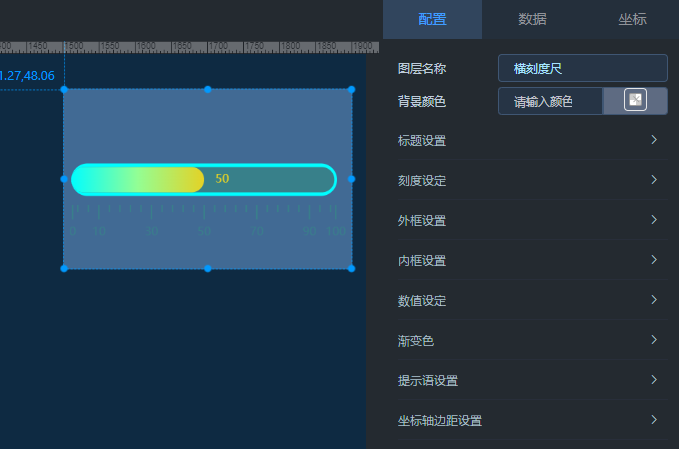
#### 数据格式
单一的数值字段,可看静态数据。
## 表单
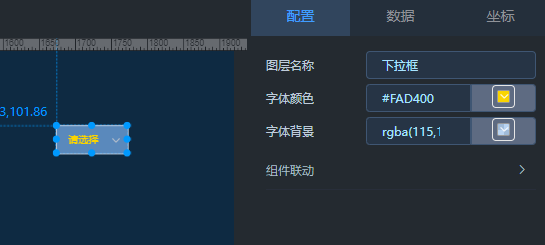
### 下拉框
下拉框组件联动的使用方式请看图表联动里面的详细描述。
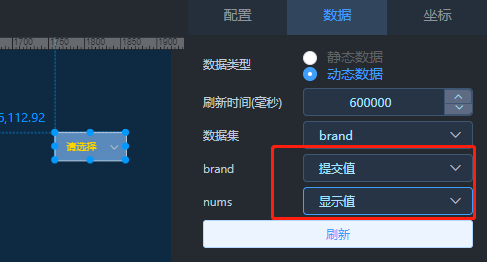
#### 数据格式
“提交值”指的是下拉框提交给联动的组件字段名和字段值,“显示值”是指下拉框自身下拉按钮显示的值。动态数据需要至少1个字段,如果只有一个字段请选择“提交值”,最多2个字段,“提交值”“显示值”,只能选择一个,不能同时都选。
注意下拉框的静态数据只是作为参考用的,并不参与解析。
**如有问题,请提交 [Issue](https://gitee.com/anji-plus/report/issues)
**
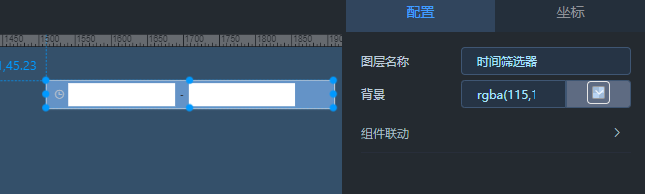
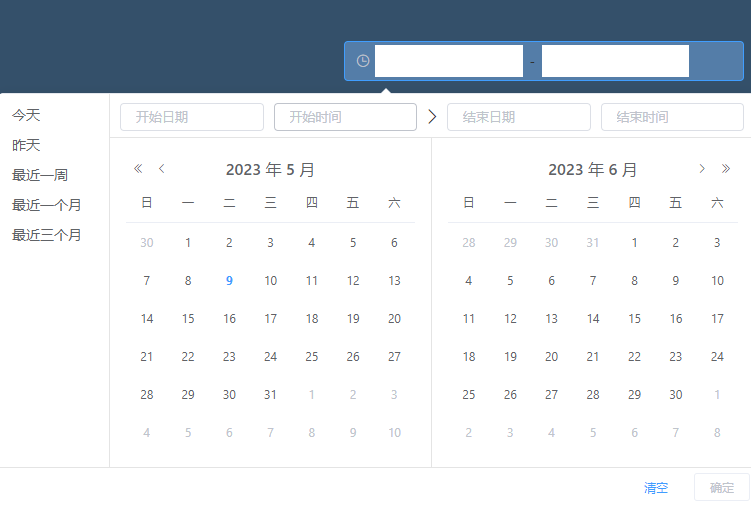
### 时间筛选器
默认支持的时间格式是"yyyy-MM-dd HH:mm:ss",其他日期格式暂不支持,需要自己把自己数据集中时间字段格式化成同种格式。
时间筛选器组件联动的使用方式请看图表联动里面的详细描述。